See the Bigger Picture
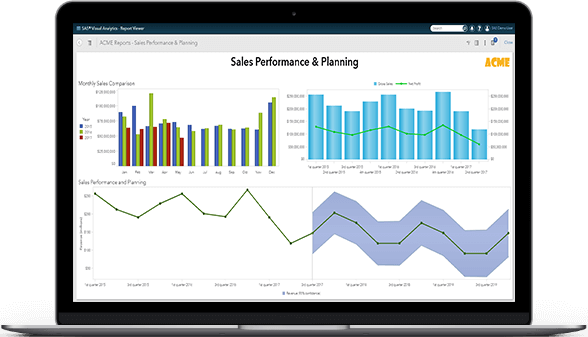
Denologix provide the entire solution - not just the toolset. Our quick start solution lets you explore all of your data,
quickly and efficiently, giving you a bird's-eye view of your business. The software automatically highlights key relationships,
outliers, clusters, trends, forecasts and more. Find out why something happened, even
identify critical drivers. It provides
you vital insights that inspire action.
Your time is money, let us do the work
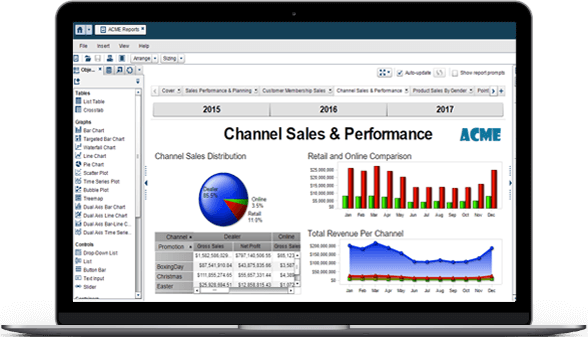
Denologix does what other companies can't - we take the work out of the equation. Enter all of your raw data, from any source, then sit back and watch the magic. Our tool automatically transforms your data into powerful and interactive visuals that are customizable to suit your needs. It allows your team to effortlessly dig deeper and brings it all together in one simple view.
Learn More
Take action with confidence
By performing data quality and integrity checks, data enrichment, and output validation tests, Denologix scales to support whatever size environment you require. Make investments, and operating decisions, with more confidence and mitigated risk by becoming a data-driven organization. Ensure quick and efficient pivoting, with immediate benefits.
Learn More
Easy-to-use analytics for everyone
Whether youʼre a business analyst, executive, data scientist or statistician, no coding or experience is necessary. From individual analysis to exploratory analytics, Denologixʼ Quick Start Analytics Platform has helped a wide range of companies gain access to valuable insights assuring better decisions and higher returns.
Learn More
Just SOME of the Questions
We Can Help Answer

What is our risk exposure with specific
solutions, customers and/or products?
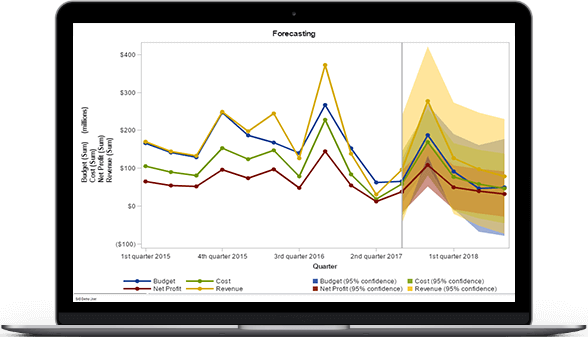
See into the future by providing forward-looking,
strategic insights. Not just backward-looking
financial reporting.

How can we streamline and enhance our
business processes to make them more
efficient?
Turn mountains of data into nuggets of vital
information.

Are we investing in the right opportunities, at the right time, based on capital and/or revenue?
Filter and analyze large amounts of data promptly and easily.

How profitable are my products and
services across sales channels and
customers?
Put the pieces together and paint a picture. Combine internal and external data to generate statistical insights that weren't possible or practical before.

Which customer segments may offer the largest margins, now and in the future, and how are those margins affected by the choices we're making today?
Present data visually so the results are easier to
understand and have more impact.

How are we tracking against our Sales Target?
Make investment and operating, decisions with more confidence and less risk.

1

2

3

4

5

6


